Flip a switch and the lights turn on—simple. But behind that instant glow lies a churning, complex set of forces that shape how much electricity we use, when we use it, and why it spikes or slumps from hour to hour and season to season. To understand what affects electricity consumption the most, we need to step back and trace demand all the way from weather and wages to building codes, business cycles, and the devices we plug in. This deep dive will map the terrain: the fundamentals of demand, the outsized role of temperature and technology, and the accelerating impact of electrification—from electric vehicles and heat pumps to hyperscale data centers powering AI.
The Mechanics of Demand: Why Electricity Use Rises and Falls
Electricity demand is not a single number; it’s a moving profile that swells and shrinks throughout the day. Three concepts frame the discussion:
- Load level: The instantaneous power drawn from the grid (measured in MW or GW). This is the “now” of demand.
- Energy consumption: The total electricity used over time (kWh or MWh). This is the “how much over a period.”
- Load shape: The pattern of demand over a day, week, or year—mornings ramp up, afternoons may peak, nights fall, and seasons shift the whole curve.
Electricity is unique because large-scale storage is still expensive and limited compared with the scale of demand. Supply must match demand in real time, which is why the timing and shape of use matter almost as much as total volume. This is also why seemingly small changes—like a heatwave or a holiday—can ripple across the grid.
Base Load vs Peak Load
Base load is the steady, always-on portion of demand (think refrigeration, servers, hospital equipment), while peak load captures the highest bursts (often late afternoon in hot climates or early evening in cold regions). Policies, prices, and technologies that flatten peaks can save billions by deferring new infrastructure and cutting the need for peaker plants.
What Affects Electricity Consumption the Most? Core Drivers Explained
Across regions and sectors, five categories consistently dominate how much power we use and when:
- Weather and climate (temperature extremes and humidity) drive heating and cooling loads.
- Economic activity and income influence production, services, and appliance ownership.
- Technology mix and efficiency determine how much energy is needed to get the same job done.
- Electrification trends add new loads (EVs, heat pumps, data centers) and shift timing.
- Prices, tariffs, and behavior nudge when and how much consumers and businesses use.
Let’s unpack each driver and how they interact.
Weather and Climate: Temperature’s Outsized Footprint
Weather is often the single biggest short-term variable shaping grid demand. Hot summers trigger air-conditioning surges; frigid winters send heaters roaring. Utilities and grid operators track cooling degree days (CDD) and heating degree days (HDD) to forecast these swings. A hotter-than-average week can set new records, while a mild shoulder season slashes consumption.
How Heat and Cold Amplify Load
- Air conditioning: Demand rises nonlinearly during heat waves. Every additional degree above a comfort threshold can unleash millions of extra kilowatts for cooling.
- Electric heating: In regions with electric resistance heaters or heat pumps, cold snaps trigger morning and evening peaks.
- Humidity: Sticky air strains AC systems because they must remove moisture as well as heat, further boosting power draw.
Climate change intensifies both extremes. Higher average temperatures raise baseline cooling needs, while polar vortex events or sudden winter storms can still drive heating surges. Over time, this raises the question at the heart of planning: what affects electricity consumption the most in a warming, more volatile climate? The answer increasingly points to weather interacting with the technologies in our homes, offices, and industries.
Income, Economic Activity, and Industry Mix
The composition and pace of an economy have a profound impact on electricity use. As incomes rise:
- Households acquire larger homes, more appliances, and better comfort systems—all adding load.
- Businesses expand production and services, which increases process loads, HVAC, and IT equipment.
But it’s not just about getting richer; it’s about what an economy does. A service-heavy region has a very different load profile from a manufacturing hub. Steel mills, chemical plants, and cement kilns are intense electricity users (or heavy fuel users that may electrify in the future), while professional services consume less per unit of GDP but may concentrate usage in dense commercial districts.
Recessions, Booms, and Structural Shifts
Economic cycles change electricity use. Recessions typically flatten or reduce industrial and commercial loads, while booms lift them. Long-run structural shifts—like moving from manufacturing to services or reshoring industry—reshape regional electricity trends. Urbanization and the rise of data-driven businesses have also shifted usage toward commercial buildings and data centers.
Technology Mix and Efficiency: Doing More with Fewer Watts
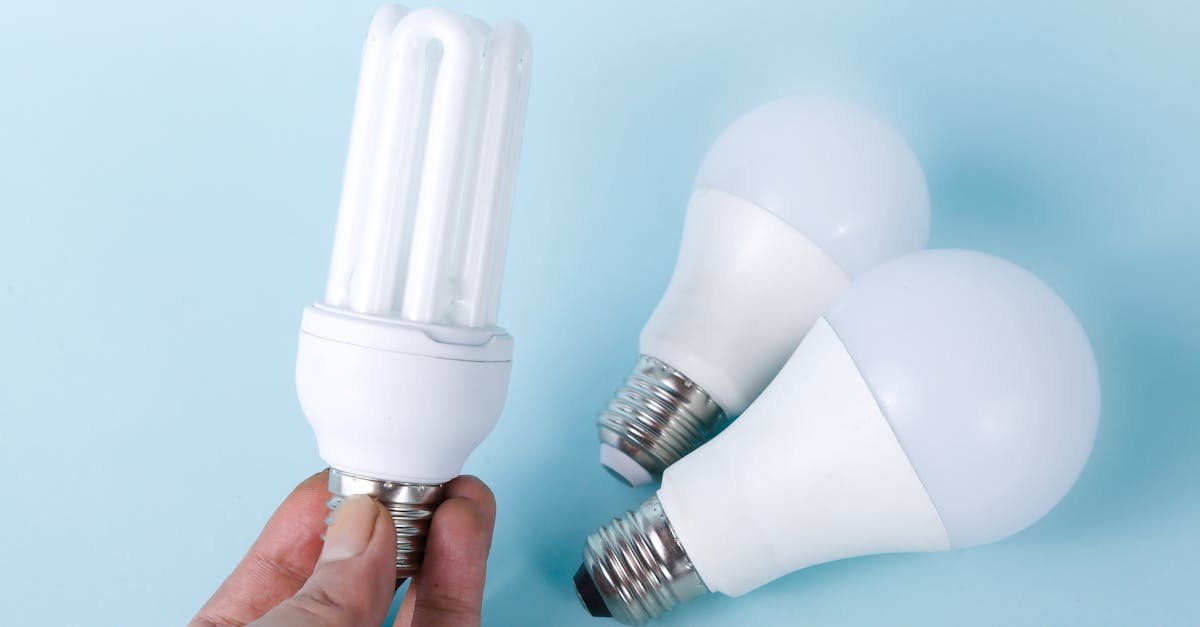
Technological progress has steadily chipped away at electricity intensity. LED lighting, variable-speed motors, high-efficiency HVAC, and ENERGY STAR appliances deliver the same output with less input. In many advanced economies, these gains helped stabilize per-capita electricity use even as device ownership rose.
The Efficiency vs. Rebound Dance
Efficiency cuts consumption, but the rebound effect can claw back some savings. When operating costs fall, people may use devices more (cooling a bit colder, lighting more hours, larger TVs). Still, net savings typically remain positive—especially when paired with smart controls and pricing signals.
New Loads vs. Smarter Loads
- Smarter HVAC: Heat pumps, smart thermostats, and demand-response capable systems trim peak loads and total usage.
- IT and electronics: Laptops, phones, and servers have improved efficiency per computation, but the sheer growth in computing, streaming, and cloud services offsets some gains.
- Appliances: Fridges, washers, and dishwashers are far more efficient than models from the 1990s or early 2000s. Yet larger sizes and added features complicate the picture.
Electrification: EVs, Heat Pumps, and the New Load Landscape
Decarbonization policies are shifting energy services away from combustion to electricity. This trend simultaneously raises electricity demand and lowers total energy system emissions when paired with cleaner grids.
Electric Vehicles (EVs) and Charging Patterns
EV adoption adds sizable new demand, but timing is pivotal. Most home charging occurs overnight, which can be helpful for grid balancing if off-peak rates and smart chargers are used. Workplace and public fast charging create different load shapes—sometimes mid-day peaks or event-driven surges (holiday travel, sporting events). At scale, managed charging (and eventually vehicle-to-grid) can turn EVs into flexible assets rather than rigid loads.
Heat Pumps and Building Decarbonization
High-efficiency heat pumps can slash heating energy compared with resistance heat or oil furnaces, especially in mild climates. In colder regions, modern cold-climate heat pumps still perform well but may drive winter peaks if installed widely. Building envelope upgrades—insulation, air sealing, high-performance windows—are critical companions to keep winter demand manageable.
Industrial Electrification
Electrifying low- to medium-temperature process heat and adopting electric arc furnaces or heat pump dryers can lift industrial loads while lowering emissions. Flexible scheduling and thermal storage help smooth impacts on peak demand.
Prices, Tariffs, and Incentives: The Economics of When and How
Electricity prices influence usage. While short-run price elasticity can be modest, well-designed tariffs and rebates can move both total consumption and load shape significantly.
Time-of-Use (TOU) and Demand Charges
- TOU rates incentivize shifting use to off-peak hours—great for EV charging, water heating, or running dishwashers overnight.
- Demand charges (common for commercial/industrial customers) penalize short bursts of high power draw, encouraging peak shaving, storage, and load management.
Real-time pricing and critical peak pricing go further, aligning consumption with actual system costs and renewables availability. Incentives for smart thermostats, efficient appliances, and weatherization accelerate lasting reductions.
Behavior and Culture: Comfort, Habits, and Defaults
Human behavior stitches together every other factor. Thermostat settings, lighting habits, how often laundry runs, and whether devices are left on standby—all matter. Defaults are powerful: if smart appliances ship with energy-saving modes on, usage falls with no extra effort. Social norms help too; building managers sharing energy dashboards or competitions can unlock notable savings in offices and campuses.
Education and Feedback Loops
Granular feedback via in-home displays or apps lets people see cause and effect: a hot day pushes AC, the oven spikes demand, the EV charges faster than needed. Nudges like suggested schedules or comfort ranges often cut consumption without sacrificing quality of life.
Policy and Regulation: Building Codes and Standards
Efficiency standards for appliances and HVAC, along with progressive building codes, permanently lower loads across entire markets. These policies are among the most cost-effective tools for flattening growth while improving comfort and performance.
Sector-by-Sector: Where the Watts Go
Granular insights help target solutions. Here’s how drivers play out across sectors:
Residential
- HVAC: The largest variable load in many homes. Weather dominates; efficiency and thermostats modulate.
- Water heating: A steady contributor. Heat pump water heaters cut usage substantially and can run off-peak.
- Appliances and lighting: Efficient models and LEDs reduce baseline draw.
- Entertainment and electronics: TVs, consoles, set-top boxes, and routers add up. Standby power is small per device but significant in aggregate.
- EV charging: A growing share; highly shiftable with TOU rates and smart chargers.
Commercial
- HVAC and ventilation: Major drivers, with occupancy patterns shaping peaks.
- Lighting: Rapid LED retrofits have slashed demand, but controls are crucial for ongoing savings.
- IT loads: Offices, retail, and especially data centers drive steady base loads and cooling needs.
- Refrigeration: In groceries and hospitality, refrigeration is a core, often continuous load.
Industrial
- Motors and drives: Motors power pumps, fans, conveyors—variable speed drives and right-sizing deliver big savings.
- Process heat: Electrification and heat recovery can change both totals and timing.
- Compressed air: Often inefficient; leak detection and pressure optimization matter.
Agriculture and Water
- Irrigation, pumping, and treatment: Highly seasonal and weather-dependent; TOU and storage can help shift loads.
Regional and Seasonal Patterns
Geography and climate carve distinct demand signatures.
Hot vs. Cold Climates
- Hot, humid regions peak in late afternoons during summer; AC dominates.
- Cold regions often peak winter mornings or evenings; heating rules.
- Temperate zones enjoy long shoulder seasons with low loads, punctuated by heat waves or cold snaps.
Urban Heat Islands and Microclimates
Cities retain heat overnight, extending cooling loads and driving nighttime demand. Coastal breezes, altitude, and vegetation create micro-variations that matter for local planning and distribution networks.
Workdays, Weekends, and Holidays
Commercial and industrial loads ebb on weekends and holidays, while residential share rises. Major sporting events, festivals, and mass travel can cause short spikes or shifts in timing.
Data Centers, AI, and the New Megawatt Movers
Cloud computing and AI are reshaping load growth in many regions. Data centers cluster near cheap, reliable power and high-capacity fiber routes, adding large, steady base loads and significant cooling demand. AI training is compute-intense and bursty; AI inference is steadier but widespread. Operators improve PUE (Power Usage Effectiveness) with better cooling (liquid, rear-door heat exchangers), equipment refresh cycles, and waste-heat recovery. Still, rapid AI adoption can outpace efficiency gains, making siting, grid integration, and on-site renewables pivotal.
What Affects Electricity Consumption the Most? A Ranked View
No single factor explains every region, but in most power systems, the following rank highly:
- Weather and temperature extremes (including humidity): The most powerful short-term driver of peaks and seasonal shifts.
- HVAC intensity and building stock efficiency: Determines how much weather translates into watts.
- Economic activity and industry mix: Sets the baseline and volatility for commercial/industrial loads.
- Electrification of transport and heat: Adds new, sometimes flexible loads that reshape timing.
- Tariffs and incentives (TOU, demand charges, rebates): Strong influencers of when, and sometimes how much, people and firms use.
- Technology efficiency and controls: Constantly improving the “watts per unit of service.”
- Behavioral patterns and defaults: The glue that turns potential savings into actual reductions.
- Policy and standards: Slow-burn, system-wide improvements that compound over time.
Put plainly, if you’re asking what affects electricity consumption the most across the widest set of contexts, the combined punch of weather and HVAC/building efficiency tends to dominate peaks and seasonal variation, while economic activity and electrification steer long-run growth and load shape.
Measuring and Forecasting Demand
You can’t manage what you don’t measure. Today’s tools illuminate where electricity goes and how to steer it.
Smart Meters and AMI
Advanced metering infrastructure (AMI) captures interval data (e.g., every 15 minutes), revealing load shapes at the household or business level. This enables personalized feedback, targeted efficiency, and time-based rates.
Weather Models and Degree Days
Utilities calibrate demand forecasts with temperature, humidity, wind, and solar irradiance. CDD and HDD remain staples for day-ahead and week-ahead predictions; high-resolution forecasts improve peak day readiness.
Econometrics vs. Machine Learning
- Econometric models (like ARIMA, regression with exogenous variables) are interpretable and robust for many planning horizons.
- Machine learning (gradient boosting, LSTM networks) can capture nonlinearities and complex interactions across weather, prices, and behavior.
Hybrid approaches are common: use interpretable baselines plus ML for edge cases, structural breaks, or localized patterns.
Load Disaggregation and End-Use Analytics
Non-intrusive load monitoring (NILM) and submetering break whole-home or whole-building data into end uses (HVAC, water heating, refrigeration). This clarifies which actions save most for a specific customer.
Cutting Demand Growth Without Sacrificing Comfort
Demand-side strategies reduce bills, enhance grid reliability, and shrink emissions—often with quick paybacks.
Upgrade the Envelope and HVAC
- Insulation and air sealing stabilize indoor temperatures, shrinking both peaks and totals.
- High-efficiency heat pumps and right-sized ductwork deliver comfort at lower electricity use.
- Smart thermostats pre-cool/pre-heat during off-peak hours and automate efficiency.
Lighting, Appliances, and Plug Loads
- LEDs and controls reduce lighting demand by 50–80% versus legacy tech.
- Efficient refrigerators, washers, and dishwashers save year after year.
- Smart power strips and low-standby devices chip away at background usage.
Flexible Loads and Demand Response
- EV smart charging shifts energy to off-peak windows; workplace and fleet charging can respond to grid signals.
- Water heaters and thermal storage soak up cheap, clean power and release comfort later.
- Commercial load management flattens peaks via advanced controls, storage, and process scheduling.
Pricing and Behavioral Nudges
- Time-of-use rates align cost with system stress and renewables availability.
- Bill comparisons and energy reports turn abstract kWh into actionable insights.
- Incentives accelerate adoption of proven efficiency upgrades.
Case Patterns: How Drivers Interact
In practice, the biggest forces rarely act alone:
- Heatwave + inefficient buildings: Massive summer peaks. Solution: deep retrofits, reflective roofs, demand response.
- Cold snap + electric heating: High winter morning/evening peaks. Solution: weatherization, heat pump optimization, thermal storage.
- Rapid EV uptake + flat rates: Clustering of evening charging spikes. Solution: TOU rates, managed charging, distributed storage.
- Data center corridor + constrained grid: Elevated base load and local congestion. Solution: on-site renewables, grid upgrades, waste heat reuse, strategic siting.
Frequently Asked Questions
What affects electricity consumption the most in a typical home?
Heating and cooling dominate in most climates. The efficiency of your building envelope and HVAC system, along with thermostat settings and weather, drive the majority of swings. Water heating and major appliances follow.
Does electrification always raise bills?
Not necessarily. Heat pumps and EVs are highly efficient; paired with TOU rates and smart controls, they can lower total energy costs versus fossil alternatives, even as electricity usage rises.
How do prices influence usage?
Flat rates mute consumer response. Time-based rates and clear feedback encourage shifting flexible loads to cheaper, cleaner hours, reducing peaks and total costs.
Are data centers the biggest new driver?
In some regions, yes—especially where large campuses connect to limited grids. Nationally or globally, EVs and building electrification may outpace them, but local effects from data centers can be dramatic.
Key Takeaways
- Weather reigns over short-term peaks, especially through HVAC. The efficiency of buildings decides how hard weather hits.
- Economic activity and technology set the baseline and trajectory of demand.
- Electrification adds new, manageable loads; done right, it can lower bills and emissions.
- Prices and behavior shape when we use power and unlock flexible demand.
- Standards and codes deliver quiet, compounding savings across entire markets.
A Practical Answer to the Big Question
If you need a single, practical answer to the question of what affects electricity consumption the most, it’s the combination of weather and HVAC/building efficiency for day-to-day and seasonal variability—followed by economic activity and electrification for long-term trends. Layer in smart pricing, controls, and standards, and you can cut costs and carbon without sacrificing comfort.
Next Steps: Turning Insight into Action
- Households: Seal and insulate, adopt a smart thermostat, consider a heat pump and heat pump water heater, and put EV charging on a TOU schedule.
- Businesses: Audit loads, right-size HVAC, upgrade to LEDs and controls, manage peaks with storage and demand response, and track performance with dashboards.
- Policymakers and utilities: Expand AMI, modernize rates, fund weatherization, raise efficiency standards, and guide electrification toward flexible, low-peak adoption.
In a grid increasingly powered by renewables and shaped by digital demand, understanding the forces behind electricity use is no longer optional. It’s the foundation for resilient systems, affordable bills, and a cleaner future.