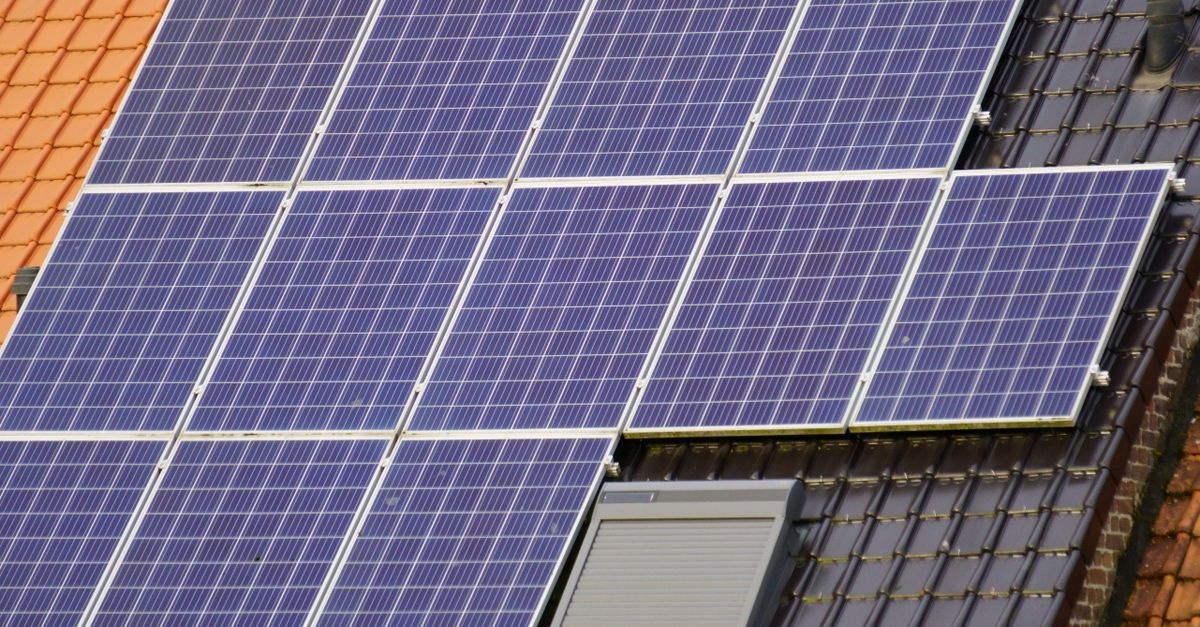
There’s a moment every homeowner looks forward to after installing solar panels, a heat pump, or a home battery: the day the system has paid for itself. Getting to that point depends on more than sunshine or kilowatt-hours—it’s about incentives, design, habits, and smart math. Here’s how to predict, accelerate, and celebrate that payback.
Why Payback Matters—and What It Really Means
Home energy projects are different from most upgrades. Unlike granite countertops, a photovoltaic (PV) array or an air-source heat pump can generate measurable cash savings month after month. The first milestone is the break-even point—the date when cumulative savings equal what you invested. But there’s more to the story than a single date.
The Key Metrics Behind “Paying for Itself”
- Simple payback period: Initial cost divided by average annual savings. It’s easy to explain, but it ignores time value of money, maintenance, and future energy price changes.
- Net Present Value (NPV): The present value of all future cash flows minus your upfront and ongoing costs. Positive NPV means your project creates value compared with doing nothing or leaving cash in a savings account.
- Internal Rate of Return (IRR): The effective annual rate your project yields over its life. If IRR exceeds your alternative investments (e.g., mortgage rate or bond yields), it’s a strong financial move.
- Levelized Cost of Energy (LCOE): The lifetime energy cost per kWh from your system (including financing, maintenance, and replacements). If your LCOE is below your utility rates, you’re winning.
These metrics answer different questions. Simple payback tells you when you break even; NPV and IRR tell you how well the project performs financially. LCOE tells you how cheap your self-generated energy really is.
What Determines Your Payback Timeline?
There’s no universal clock for the day your home renewables start paying back. However, the drivers are remarkably consistent across technologies.
1) Upfront Cost and Financing Structure
- Hardware + Balance of System: Panels, inverters or microinverters, racking, labor, permits, and design. For heat pumps: indoor/outdoor units, ductwork, or hydronic adaptations. For batteries: cells, inverter-charger, gateway, installation.
- Financing: Cash purchases lower total cost and typically shorten payback. Loans spread payments but add interest; if your interest rate is below your project’s IRR, you still come out ahead. PACE financing and green home loans can lower barriers.
2) Incentives and Policy
- Tax credits and rebates: Federal, state, and local incentives can slash 10–50% off sticker price.
- Performance incentives: SRECs (solar renewable energy certificates), feed-in tariffs, and virtual power plant (VPP) payments generate ongoing revenue.
- Net metering rules: Retail-rate crediting can dramatically improve value; reduced export rates or time-of-use (TOU) crediting shift strategy toward self-consumption and storage.
3) Energy Prices and Rate Design
- Retail rates: Higher electricity or heating fuel prices (propane, oil, natural gas) speed payback.
- TOU pricing: Aligning production and use with peak hours increases savings.
- Demand charges: For some utility customers, batteries can lower peak demand and save big.
4) System Performance and Design
- Production: For PV, roof orientation, tilt, latitude, and shading drive output. For heat pumps, climate and sizing matter. For wind, site wind speeds are critical.
- Degradation: PV panels typically lose ~0.3–0.7% output per year; good warranties protect you.
- Component choices: Microinverters or power optimizers can help in partial shading; variable-speed heat pumps enhance seasonal efficiency.
5) Usage Patterns and Efficiency
- Self-consumption: The more energy you use when you produce it (running laundry or EV charging during the day), the greater your savings under export-limited policies.
- Efficiency upgrades: Air sealing, insulation, LEDs, and smart thermostats lower loads and improve the economic case for smaller, cheaper systems that reach payback sooner.
Typical Payback Timelines by Technology
Real-world experiences vary, but these ranges capture common outcomes in mature markets with mainstream incentives. Use them as a starting point, not a promise.
Rooftop Solar PV
- Simple payback: ~5–10 years in high-rate, incentive-rich regions; ~9–14 years where export rates are low or incentives minimal.
- Drivers: Retail rates, net metering rules, rooftop orientation/shade, installed cost per watt, and tax credits.
- Lifetime: 25–30+ years with inverter replacement once around years 10–15 (unless using microinverters with longer warranties).
Where net metering credits are near retail rates, solar commonly hits break-even well before year 10. In export-restricted markets, self-consumption strategies and modest battery capacity can restore strong economics.
Home Battery Storage
- Simple payback: ~6–12 years when stacked values exist (TOU arbitrage, demand charge reduction, VPP revenue, outage mitigation value). Longer where grid benefits are limited.
- Drivers: TOU spreads, utility programs, VPP payouts, battery cost per kWh, and cycle life.
- Lifetime: 10–15 years depending on chemistry and cycling.
Batteries rarely pay for themselves on arbitrage alone in flat-rate markets, but combine TOU optimization with demand charge reduction and grid services and the case strengthens substantially.
Air-Source Heat Pumps (Space Heating and Cooling)
- Simple payback: ~5–12 years, depending on climate, existing fuel displaced (propane/oil vs. natural gas), and incentives.
- Drivers: Seasonal COP/HSPF, electricity rates, what you’re replacing, and ducting/installation complexity.
- Lifetime: 12–20 years with routine maintenance.
Replacing resistance heating or fossil furnaces in regions with high delivered fuel prices can yield rapid savings. Integrating with rooftop solar can further compress the payback window.
Ground-Source (Geothermal) Heat Pumps
- Simple payback: ~7–15 years (higher upfront cost, stellar efficiency).
- Drivers: Incentives, drilling/loop costs, building load, and fuel displaced.
- Lifetime: 20–25 years for the heat pump; ground loop 50+ years.
Solar Thermal (Domestic Hot Water)
- Simple payback: ~4–9 years where hot water demand is high and incentives strong.
- Drivers: Fuel prices (electricity, propane, gas), demand profile, and collector efficiency.
- Lifetime: 15–20 years with periodic maintenance.
Small Wind (Residential)
- Simple payback: Highly site-dependent; many residential sites lack sustained wind speeds needed for strong economics.
- Recommendation: Prioritize anemometer studies and realistic production models before committing.
Policy and Incentives: The Hidden Accelerator
Public policy can instantly move the needle on payback by 2–5 years. Understand your stackable benefits:
- Tax credits: Percentage-based reductions on eligible costs for solar, batteries, and heat pumps in many countries.
- Point-of-sale rebates: Utility or regional programs cut upfront prices immediately.
- Performance-based incentives: SRECs, feed-in tariffs, and capacity payments for VPP participation can yield ongoing cash flow.
- Low-interest loans: Public green banks or energy authorities often offer attractive financing.
- Net metering and export compensation: Rules vary widely; learn your export rates, caps, and time windows.
Financing Options and Their Impact on Returns
How you pay matters as much as what you buy. The financing method can change when renewable installations start paying off in your specific case.
- Cash: Lowest total cost, fastest break-even, maximum long-term savings.
- Secured home energy loans: Competitive rates spread over 5–20 years; align loan term with equipment life for healthy cash flow.
- PACE (Property Assessed Clean Energy): Repaid through property taxes; can be transferred with the property depending on jurisdiction.
- Leases and PPAs: Lower or zero upfront cost; immediate bill savings but generally smaller lifetime value versus ownership.
How to Model Your Own Payback (Step by Step)
Use this practical, transparent method. Adapt the inputs to match your rates, incentives, and equipment quotes.
Step 1: Gather Inputs
- System specs: PV kW size and expected kWh/year; heat pump efficiency (SEER/HSPF/COP); battery usable kWh and round-trip efficiency.
- Costs: Installed price, permits, and expected replacements (e.g., inverter at year 12).
- Incentives: Tax credits (percent), rebates (cash), performance payments (SRECs/VPP), and net metering/export rates.
- Utility rates: Flat or TOU pricing; current $/kWh, demand charges, and escalators (e.g., 2–4%/year).
- Usage profile: Annual kWh and hourly/seasonal shape to estimate self-consumption vs. exports.
Step 2: Estimate Annual Savings
For PV under retail-rate netting:
- Bill reduction: Self-consumed kWh × retail rate
- Export credit: Exported kWh × export rate (may be retail or lower; may vary by hour)
- Performance incentives: SRECs or feed-in payments × production
For batteries:
- TOU arbitrage: (Peak rate − off-peak rate − losses) × shifted kWh
- Demand reduction: Monthly demand drop × demand charge × 12
- Grid services: VPP payments or capacity revenue
For heat pumps:
- Fuel cost avoided: Replaced kWh/therms/gal × previous fuel price
- Cooling efficiency gains: Compare to prior AC efficiency
Step 3: Account for Degradation and Maintenance
- PV production decline: ~0.3–0.7% per year (use your panel warranty rate).
- Component replacement: Inverter/battery replacements per warranty terms and cycle life.
- O&M: Occasional cleaning, monitoring, filters for heat pumps, and service visits.
Step 4: Choose Your Financial Lens
- Simple payback: Upfront net cost ÷ first-year savings.
- NPV: Discount future savings at a conservative rate (e.g., 4–6%). Sum discounted cash flows, subtract net costs.
- IRR: The discount rate that sets NPV to zero; compare to your loan rate or market alternatives.
Worked Example: A 7 kW Rooftop Solar System
Assume:
- Installed cost: $2.75/W → $19,250
- Tax credit: 30% → −$5,775; Net upfront = $13,475
- Production: 9,100 kWh/year; degradation 0.5%/yr
- Retail rate: $0.26/kWh; Export rate: $0.18/kWh; 55% self-consumed, 45% exported
- SRECs: $25/MWh → $227.50/yr initially
- O&M: $150/yr average; Inverter replacement year 13 = $2,000 (nominal)
- Utility rate escalator: 3%/yr; Discount rate: 5%
Year 1 savings:
- Self-consumption: 9,100 × 0.55 × $0.26 = $1,301
- Exports: 9,100 × 0.45 × $0.18 = $737
- SRECs: $228
- Gross savings ≈ $2,266; Net savings after O&M ≈ $2,116
Simple payback: $13,475 ÷ $2,116 ≈ 6.4 years. With escalating rates and SRECs, discounted NPV remains positive and IRR typically in the high single digits to low double digits—strong versus many low-risk investments.
Maximizing the Moment Your System Pays for Itself
Want to bring the break-even date forward? Tune the controllables.
- Design for self-consumption: Right-size PV to your daytime loads, add a smaller battery to catch afternoon peaks, and shift flexible loads (laundry, dishwashing) to sunny hours.
- Leverage TOU and demand response: Program your battery and smart appliances to avoid peak rates and earn incentive payments.
- Electrify strategically: Pair solar with an air-source heat pump and heat pump water heater to replace costly fuels and capture compounding savings.
- Manage EV charging: Schedule mid-day home charging; if rates favor night charging, consider solar diversion to a battery first.
- Keep systems healthy: Clean panels (if dusty), replace filters, and monitor performance. Small maintenance keeps your ROI on track.
Common Pitfalls That Delay Payback
- Ignoring shading studies: Even partial shade can slash production. Request a shade analysis and consider microinverters/optimizers.
- Over-sizing without a plan: Bigger isn’t always better if export rates are low and self-consumption is limited. Match system size to realistic loads.
- Assuming flat rates forever: Many utilities shift to TOU pricing; plan for rate evolution and storage value.
- Skipping efficiency: Sealing and insulation can yield faster savings and let you downsize equipment.
- Underestimating maintenance and replacements: Include inverter/battery replacement in your financial model.
Regional Snapshots: How Location Shapes Payback
United States
- Sun Belt and West Coast: High solar resource and higher retail rates have historically meant faster PV paybacks. Where export rates have shifted to TOU-based credits, adding smart load control or batteries can preserve strong returns.
- Northeast: Higher electricity prices and robust incentives can offset less sun. Heat pumps often shine due to expensive oil/propane displacement.
- Midwest: Moderate rates and good net metering in some states yield solid projects; heat pumps excel in efficient homes with weatherization.
Europe
- Germany and Benelux: Mature markets, competitive installed costs, and self-consumption emphasis; batteries increasingly valuable with dynamic tariffs.
- UK and Ireland: High retail rates and export programs make rooftop solar + heat pumps compelling; insulation standards amplify savings.
- Southern Europe: Strong solar resource and cooling loads align well; PV payback often within a decade even with modest incentives.
Australia
- Rooftop solar leader: Low installed costs, high sun, and retail rates deliver some of the fastest PV paybacks globally. Export tariffs vary by state; daytime self-use and batteries can improve returns.
FAQs: Straight Answers to Big Questions
How soon do home renewable systems usually pay for themselves?
PV commonly breaks even within 5–12 years depending on rates, incentives, and design. Batteries vary widely (6–12 years with stacked value). Heat pumps often hit payback in 5–12 years, faster where expensive fuels are displaced.
What if export rates are low in my area?
Design for higher self-consumption: shift loads, right-size your array, add a modest battery, and explore utility programs (demand response, VPPs). These strategies can move the needle on when your installation starts paying back.
Do maintenance and component replacements ruin the ROI?
No—if you model them honestly. Budget for inverter or battery replacements and routine maintenance. Strong systems still deliver robust NPV and IRR over 20–30 years.
Is cash the only way to get a fast payback?
Cash shortens payback, but a low-interest loan can still produce positive cash flow if your annual savings exceed the loan payments. IRR above your loan rate signals a financially sound project.
How accurate are installer savings estimates?
Good firms use satellite/3D shading data and your rate structure. Ask for assumptions on degradation, rate escalation, export credits, and maintenance. Request scenarios (optimistic, base, conservative) to bracket outcomes.
Looking Ahead: Trends That Improve Payback
- Smart tariffs and dynamic pricing: More opportunities to monetize flexibility with batteries and smart appliances.
- Virtual power plants: Aggregated batteries and heat pumps earning capacity payments and grid support revenue.
- Falling hardware costs and better warranties: Continued improvements in PV module efficiency, inverters, and long-cycle batteries enhance lifetime value.
- Electrification synergies: Solar + heat pump + EV charging creates a compounding stack of savings and resilience.
A Practical Checklist Before You Buy
- Audit first: Capture cheap efficiency wins (air sealing, insulation, LEDs, smart thermostat).
- Gather interval data: Get hourly usage from your utility to size systems for self-consumption.
- Compare quotes apples-to-apples: Panel/inverter brands, warranties, production estimates, and assumed export credits.
- Model cash flows three ways: Cash, loan, and lease/PPA. Include O&M and replacements.
- Plan integration: If you’ll add a battery or heat pump later, design electrical and space provisions now.
- Verify incentives: Confirm eligibility windows, income caps, and stacking rules before purchase.
When Renewable Installations Start Paying Off: What It Feels Like
Reaching break-even is more than a spreadsheet milestone. It’s the day your rooftop or heat pump begins funding itself—and then funding your next project, your vacation, or your child’s college fund. For many households, the moment their clean energy system starts paying for itself represents not just savings, but control over energy costs, quieter comfort, and lower emissions.
Conclusion: From Sun to Savings—Your Next Steps
The exact date when renewable installations start paying off depends on policy, hardware, rates, and habits—but it’s never been easier to reach. Use solid metrics (payback, NPV, IRR, LCOE), design for self-consumption, stack incentives and grid services, and keep your system well-tuned. Do that, and you’ll not only hit break-even—you’ll turn your home into a reliable, long-lived generator of value.
Action plan:
- Collect your last 12 months of utility data (ideally hourly).
- Request three quotes with clear production and incentive assumptions.
- Run a base and conservative scenario including maintenance and replacements.
- Prioritize measures that improve self-consumption and qualify for strong incentives.
- Celebrate the day your system crosses into net-positive territory—and keep optimizing.