Poland is shifting from coal dependence to a renewables-driven powerhouse, propelled by industrial demand, EU climate policy, and a fast-maturing clean energy ecosystem. For investors, that shift isn’t just environmental—it’s financial. This guide explains where margins are strongest, how policy and grid conditions affect outcomes, and what structures convert megawatts into measurable, repeatable returns. If you’re asking, Which renewable energies are most profitable in Poland, read on for a nuanced, investor-grade answer.
Why Poland Is Europe’s Next Renewables Hotspot
Poland’s energy system has long relied on domestic coal, keeping lights on and prices historically predictable. Over the last years, however, several structural forces have created a once-in-a-decade opening for renewables:
- Industrial demand and reshoring: Manufacturing-heavy regions seek stable, low-carbon electricity to anchor supply chains and comply with corporate net-zero targets.
- EU ETS and carbon costs: Carbon pricing has raised the marginal cost of fossil generation, improving the relative economics of wind, solar, and clean heat.
- Policy momentum: Competitive auctions, long-term contracts for offshore wind, and corporate PPAs have built clear bankability pathways.
- Grid modernization: Transmission and distribution system operators are upgrading infrastructure while enabling solutions like cable pooling and storage co-location to integrate more variable renewables.
- Liquidity and depth: A growing market for guarantees of origin (GOs), the TGE power exchange, and a dynamic PPA scene give investors multiple revenue and hedging options.
The result is a market where well-structured projects can deliver robust, inflation-resilient returns—provided you understand resource quality, local permitting, grid realities, and the nuances of Polish contracts.
The Profitability Lens: How to Evaluate Returns in Poland
To target the most profitable opportunities, you need a consistent framework. In Poland, returns are driven by three interacting pillars: revenue stack, capture price, and cost base, wrapped by financing and risk management.
The Revenue Stack
- Merchant sales: Spot and forward power prices on TGE. Attractive in bull markets but volatile; exposure can be tailored with hedges.
- Corporate PPAs: Pricing typically references indexed power benchmarks with floors/caps or fixed-strike tenors of 5–15 years; bankability hinges on counterparty credit and shape risk allocation.
- Auctions and CfDs: Onshore wind and utility PV historically secured auction-backed support; offshore wind benefits from long-term CfDs. These reduce price risk and improve debt capacity.
- Guarantees of Origin (GOs): Additional green premium for certified renewable output; contract structure matters (volume certainty, transfer terms).
- Ancillary/balancing and co-located storage: While not a primary revenue source for RES, storage adds value via arbitrage and reduced imbalance costs, often improving net revenue capture for solar and wind.
- Thermal co-benefits (CHP/heat): Biomass and biogas assets can monetize heat for district networks or industrial processes, creating diversified income.
Capture Price Dynamics
Headline averages can mislead. What matters is the capture price—the realized price for your hourly production profile. In Poland:
- Solar PV faces mid-day discounts during high-sun seasons due to generation clustering; storage and PPAs can mitigate this.
- Onshore wind often achieves stronger capture prices in evening and winter periods when demand is high and solar is absent.
- Hybrid portfolios (wind + solar, optionally with storage) stabilize capture across seasons and diurnal cycles, enhancing bankability.
Cost Base: CAPEX, OPEX, and Soft Costs
- CAPEX drivers: Equipment prices (modules, turbines), grid connection scope, civil works, land rights, and local content requirements for offshore procurement.
- OPEX drivers: O&M contracts, spare parts, land leases, insurance, balancing costs, and statutory fees.
- Soft costs and timelines: Permitting, community engagement, environmental constraints, and grid queue timelines can dominate schedule risk.
Financing terms, inflation pass-throughs in contracts, and foreign exchange exposures (for imported equipment or EUR-linked PPAs) further tilt the economics.
LCOE and IRR: Practical Heuristics
Levelized Cost of Energy (LCOE) is a useful baseline but can hide value if your capture price is high (e.g., wind in winter peaks) or low (e.g., mid-day solar glut). Investors in Poland increasingly evaluate IRR under multiple revenue stacks—merchant-only, blended PPA/merchant, and support-backed—to quantify resilience. Sensitivity testing (±10–20% on CAPEX, ±10% on yield, ±15–30% on power prices) is essential for disciplined bidding and acquisition.
Which Renewable Energies Are Most Profitable in Poland?
Profitability depends on site quality, contract selection, and grid context, but a consistent ranking emerges in today’s market conditions. In broad, risk-adjusted terms:
- Onshore wind – Excellent capacity factors in strong wind corridors, reformed siting rules, attractive PPAs, and resilient capture prices.
- Utility-scale solar PV – Lowest CAPEX, quick build cycles, abundant sites; storage and PPAs can elevate capture price and bankability.
- Offshore wind (Baltic Sea) – Capital-intensive yet stabilized by long-term CfDs; strong industrial policy support and scale.
- Biogas/biomethane – High-margin niches near reliable feedstock, with multi-product revenue (power, heat, gas grid injection, GOs), but operationally complex.
- Biomass CHP – Attractive in district heating systems with reliable fuel supply and heat offtake; policy and sustainability criteria are pivotal.
- Small hydro – Limited greenfield potential and permitting complexity; niche, steady yields where sites exist.
- Geothermal (for heat) – Strong fit for municipal heating with grants; long lead times and subsurface risk, typically heat—not power—focused.
This ordering reflects typical risk-adjusted returns. Specific assets can outperform the ranking with outstanding resource, unique co-location benefits, or superior contracts.
Deep Dives by Technology
Onshore Wind: Poland’s Yield Workhorse
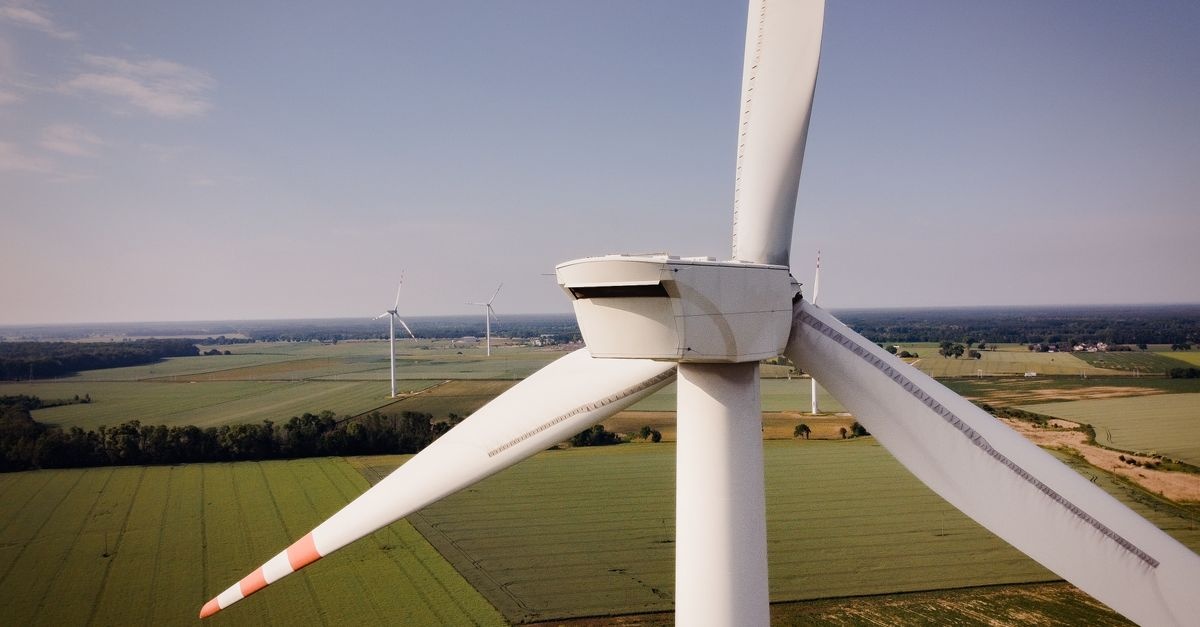
Why it leads: Best-in-class load factors in several regions, reduced daytime solar correlation, and maturing O&M supply chains. The reform of the 10H rule (now allowing development with significantly shorter setbacks where municipalities approve, often around 700 m) has re-opened the pipeline.
- Revenue model: Corporate PPAs (fixed or indexed) and merchant blends; historical auction-backed projects offer downside protection.
- Key risks: Local opposition if engagement is weak, grid connection timelines, and curtailment during low-demand/high-wind episodes.
- Value levers: Taller hub heights, optimized turbine selection, repowering legacy sites, and hybridizing with solar to smooth output.
Return profile: Many well-sited onshore wind projects can achieve robust equity IRRs under balanced PPA/merchant structures, with room to outperform through operational excellence and capture-price-aware dispatch and hedging.
Utility-Scale Solar PV: Speed, Scale, and Optional Hybrids
Why it shines: Ultra-competitive CAPEX, modularity, and rapid construction. Development is active across the country, with large clusters in regions offering available land and grid capacity.
- Revenue model: Merchant plus PPA stacks, with GOs adding premiums. Auctions provided bankable floors historically; new builds often go corporate PPA.
- Key risks: Mid-day capture price discounts and rising curtailment risk in saturated nodes.
- Value levers: East–west array orientation, co-located storage (hour-shifting), cable pooling with wind, and grid-friendly design (e.g., reactive power support).
Return profile: Even with capture discounts, disciplined CAPEX and smart contracting yield competitive IRRs. Storage-enabled or hybrid PV often climbs the profitability ranking by monetizing peak pricing and mitigating imbalance costs.
Offshore Wind (Baltic Sea): Scale and Stability
Why it’s compelling: Gigawatt-scale projects supported by long-term CfDs stabilize cash flows over decades. Resource quality in the Baltic is strong, and policy prioritizes build-out with supply chain localization.
- Revenue model: Long-tenor CfD support plus GOs; construction and operational risk are the primary variables.
- Key risks: CAPEX inflation, supply chain congestion, port logistics, and grid integration timelines.
- Value levers: Procurement timing, standardization, and digital O&M to reduce lifetime costs; innovative financing to optimize WACC.
Return profile: Lower but very stable risk-adjusted returns relative to merchant-exposed assets; attractive to infrastructure investors seeking duration and inflation linkage.
Biogas and Biomethane: Margin in the Molecules
Why it’s attractive: When paired with steady feedstock (agri-waste, municipal organic waste, food industry residues), biogas can monetize electricity, heat, and upgraded biomethane injected into gas grids. GOs and decarbonization premiums from industrial buyers add upside.
- Revenue model: Power/heat sales (often CHP), biomethane offtake with green certificates, waste gate fees.
- Key risks: Feedstock price volatility, supply chain logistics, digestate management, and permitting for grid injection.
- Value levers: Long-term feedstock contracts, co-location with farms/food plants, and heat offtakes with district heating networks.
Return profile: Potentially high equity IRRs in well-structured projects, but operational complexity demands proven operators and precise contracting.
Biomass CHP: Heat-Led Economics
Why it works: District heating operators need secure, decarbonized heat. Biomass CHP can anchor stable offtake, particularly where local sustainable fuel supply is reliable.
- Revenue model: Heat sales contracts plus power revenues and GOs.
- Key risks: Sustainability criteria, fuel price stability, and evolving policy frameworks.
- Value levers: Long-term fuel supply contracts, high availability, and integration with municipal heat planning.
Return profile: Solid but policy-sensitive; best as part of diversified portfolios or with strong municipal counterparty support.
Small Hydro and Geothermal: Focused Niches
Small hydro offers predictable generation but faces limited site availability and environmental constraints. Geothermal is increasingly compelling for municipal heating in select basins, with grants reducing capital intensity. Both are niche plays with strong local dynamics rather than broad, scalable pipelines.
Policy, Incentives, and Market Structures That Drive Returns
Poland’s policy toolkit increasingly emphasizes bankability and scale:
- Auctions and RES support: Competitive auctions historically rewarded cost-competitive onshore wind and PV with contract support that stabilized revenues.
- Offshore Wind Act and CfDs: Long-term CfDs underpin the first waves of Baltic projects, de-risking revenues and enabling project finance.
- Corporate PPAs: Rapid growth in fixed/floor/collar structures with industrials seeking green electricity and compliance with decarbonization targets.
- Prosumers and net-billing: For C&I rooftops and households, net-billing linked to market prices encourages self-consumption and right-sized systems.
- GOs and biomethane certificates: Additional revenue streams that reward verified green output; critical for biomethane project bankability.
- Public financing and EU funds: Grants and soft loans from national funds and EU facilities support grid modernization, storage pilots, and clean heat transitions, improving overall system absorptive capacity for renewables.
Grid, Permitting, and Bankability: The Practical Realities
Returns are made—or lost—in execution. In Poland, the key practicalities include:
- Connection queues: DSOs and the TSO balance high volumes of applications. Early, realistic grid studies and flexibility (e.g., hybridization, dynamic connection) are critical.
- Curtailment and nodal saturation: Solar-heavy nodes see mid-day constraints; onshore wind can experience curtailment in storms or low-demand windows. Co-located storage, hybrid profiles, and contract structures that share shape risk can protect economics.
- Permitting and communities: Transparent local engagement, biodiversity safeguards, and benefit-sharing (e.g., municipal revenues, community programs) materially reduce schedule risk.
- Balancing and forecasting: Poland’s balancing regime rewards accurate forecasting; invest in quality platforms and choose experienced BRPs to control costs.
- Bankability checklist: Yield assessments (Meteo/wind/solar resource), binding land rights, grid capacity confirmations, EPC/O&M with warranties, and creditworthy offtakers remain non-negotiable for lenders.
Risk Management and Hedging for Superior IRRs
Winning projects price risk, not just power. Leading investors in Poland deploy:
- Layered hedging: Combine corporate PPAs (5–10 years) with rolling forwards to smooth merchant exposure. Use collars/floors to stabilize cash flows without surrendering all upside.
- Inflation clauses: Index O&M and, where possible, offtake prices to inflation to protect margins.
- FX and interest management: Hedge EUR exposures for imported equipment and debt; align debt currency with revenue currency when possible.
- Portfolio synergy: Blend wind and solar to improve aggregate capture price and reduce balancing costs; add storage where grid conditions justify it.
- Regulatory agility: Structure contracts with change-in-law provisions and maintain active policy monitoring for auction design or grid code updates.
Illustrative Economics: Three Model Cases
Actual returns vary by site, contract, and financing. The following stylized cases show how structures affect profitability in Poland.
Case 1: 50 MW Utility-Scale Solar PV (Hybrid-Ready)
- Assumptions: Competitive CAPEX, strong irradiation for Poland, moderate curtailment risk, 8–10 year PPA covering 60–80% of output, remainder merchant; option to add 20–40 MWh storage later.
- Economics: Without storage, capture discounts reduce realized price; with prudent O&M and GOs, equity IRR is attractive. Adding storage to shift 1–2 peak hours can materially lift net revenue and reduce imbalance costs.
- Risks to watch: Node saturation, grid delays, EPC availability, and PPA shape penalties. Mitigate via site selection, step-in rights, and conservative scheduling.
Case 2: 48 MW Onshore Wind (PPA + Merchant)
- Assumptions: Strong wind resource, municipal buy-in, reformed setback compliance, quality turbine supplier, 10–12 year indexed corporate PPA for 50–70% of volume.
- Economics: Better capture in evenings and winter stabilizes revenue; balanced merchant exposure preserves upside. Debt sizing benefits from PPA floors and proven OEM warranties.
- Risks to watch: Curtailment in extreme weather, component lead times, and grid reinforcement costs. Address through conservative P50/P90 analysis and contingency budgets.
Case 3: 2 MW Biogas CHP with Heat Offtake
- Assumptions: Long-term feedstock contracts with agricultural partners, district heating offtake at stable pricing, digestate management in place, potential for biomethane upgrade.
- Economics: Multi-revenue stack (power, heat, GOs, gate fees) yields resilient margins. Operational excellence is pivotal; experienced operators can unlock top-quartile returns.
- Risks to watch: Feedstock variability, seasonal heat demand, and permitting for gas grid injection. Mitigate via diversified feedstock and contractual flexibility.
How to Choose Your Niche (and Win)
Align your capital, expertise, and risk appetite with the right corner of Poland’s market:
- Core infrastructure investors: Offshore wind CfDs, large onshore wind with long PPAs, and portfolio acquisitions with scale synergies.
- Value-add developers: Merchant-leaning solar and wind with storage options, hybrid parks, repowering, and grid-led strategies (e.g., capacity-secure nodes).
- Industrial energy users: Onsite C&I rooftops under net-billing, behind-the-meter PPAs, and tailored contracting to hedge production costs.
- Specialists: Biogas/biomethane integrated with waste streams, municipal geothermal heat with grants, and biomass CHP tied to secure supply.
Due Diligence Checklist
- Resource and yield: High-quality met data, bankable assessments, realistic P50/P90.
- Land and permits: Binding rights, zoning compliance, environmental studies, grid confirmations.
- Contracts: PPA bankability (credit, tenor, shape), EPC/O&M warranties and LDs, insurance coverages.
- Grid and interconnection: Technical scope, curtailment history, potential for hybridization and storage.
- Financial structure: Sensitivity-tested models, hedging policies, inflation indexation, covenant headroom.
FAQ: Investor Questions Answered
Q1: Which renewable energies are most profitable in Poland?
A: On a risk-adjusted basis, onshore wind and utility-scale solar PV currently lead, followed by offshore wind (stable, CfD-backed), and biogas/biomethane in well-structured feedstock ecosystems. Biomass CHP can be attractive with secure heat offtake. Small hydro and geothermal heat are niche but valuable in the right locales.
Q2: Are corporate PPAs essential for bankability?
A: They’re not the only route but are a powerful de-risking tool for onshore wind and PV. CfDs support offshore and auction-backed projects. Many sponsors blend PPAs with merchant exposure to balance stability and upside.
Q3: How serious is curtailment risk?
A: It’s project- and node-specific. Solar-rich areas see more mid-day constraints; wind curtailment is episodic. Mitigate by choosing uncongested nodes, adding storage, hybridizing, and structuring contracts to share shape and imbalance risk.
Q4: Is Poland still attractive for greenfield development?
A: Yes—especially for disciplined developers who prioritize grid feasibility, community engagement, and hybrid-ready designs. Repowering and acquisition of late-stage pipelines also remain active strategies.
Q5: Where do storage assets fit in?
A: Storage is not generation but can be a powerful profitability amplifier for PV and wind by boosting capture prices, reducing balancing costs, and enabling new contract shapes. Co-located or nearby BESS can elevate overall project IRRs.
Conclusion: Turning Green Potential into Bankable Gold
Poland’s energy transition is accelerating, and with it the opportunity set for investors. If you’re weighing which renewable energies are most profitable in Poland, the hierarchy is clear: onshore wind and utility PV dominate near-term risk-adjusted returns; offshore wind offers scale and stability; biogas and biomass CHP can deliver strong margins with the right offtakes and supply chains; hydro and geothermal deliver targeted, local value.
The differentiator isn’t just choosing the right technology—it’s engineering the right revenue stack, grid strategy, and risk controls. Combine disciplined development with smart contracts, hybrid profiles, and portfolio hedging, and Poland’s green gold can become a durable wellspring of cash flow in your portfolio.
Actionable Next Steps
- Map your thesis: Define target IRR, risk tolerance, and technology mix (wind/solar lead; evaluate offshore or bio for diversification).
- Screen for grid feasibility: Prioritize nodes with expansion plans and consider hybridization and storage from day one.
- Engage offtakers early: Structure PPAs with balanced shape risk, indexation where possible, and robust credit support.
- Hedge smartly: Layer forwards and options to complement PPAs, protecting downside while preserving upside.
- Build durable local partnerships: Experienced EPCs, O&M providers, and community stakeholders turn paper IRRs into realized returns.
Bottom line: With the right structures, Poland offers some of the most compelling risk-adjusted renewable returns in Europe today—and a pathway to scale.